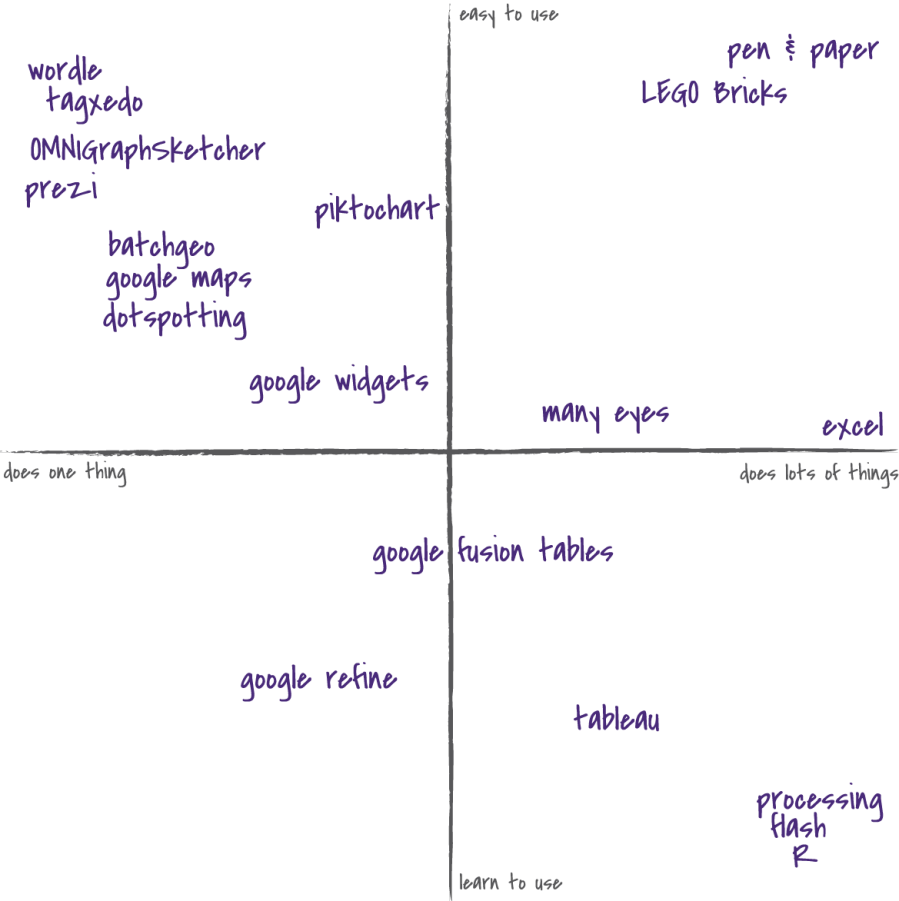
There are a lot of tools being created to help novices create data presentations. Honestly it is hard to evaluate which are worth learning, and which are just too cumbersome. To give a sense of this space, for the last few years I’ve been using this tool matrix as a way to navigate that space with community organizations.
I’ve got it on two axes – the vertical is about how easy the tool is to learn, the horizontal is about how many things the tool does. This is an incomplete on purpose – my goal isn’t to measure each tool by some arbitrary units of “ease of use”. I want to have a representative map of the space that helps people figure out what a tool can do for them.
I’d appreciate any feedback on the utility, or futility, of this map!


I like the idea of mapping out the different tools, including pen and paper! I assume the decision was deliberate to include both analog (off-computer) and software solutions here. Often, we who use computers never consider turning them off, but it may be useful sometimes.