
While at Stanford to talk about “ethical data” I had a chance to read through the latest issue of the Stanford Social Innovation Review within the walls where it is published. One particular article, Using Data for Action and Impact by Jim Fruchterman, caught my eye. Jim lays out an argument for using data to streamline operational efficiencies and monitoring and evaluation within non-profit organizations. This hit one of my pet peeves, so I’m motivated to write a short response arguing for a more expansive approach to thinking about non-profit’s use of data.
This idea that data is confined to operational efficiency creates a missed opportunity for organizations working in the social good sector. When giving talks and running workshops with non-profits I often argue for three potential uses of data – improving operations, spreading the message, and bringing people together. Jim, who’s work at Benetech I respect greatly, misses an opportunity here to broaden the business case to include the latter two.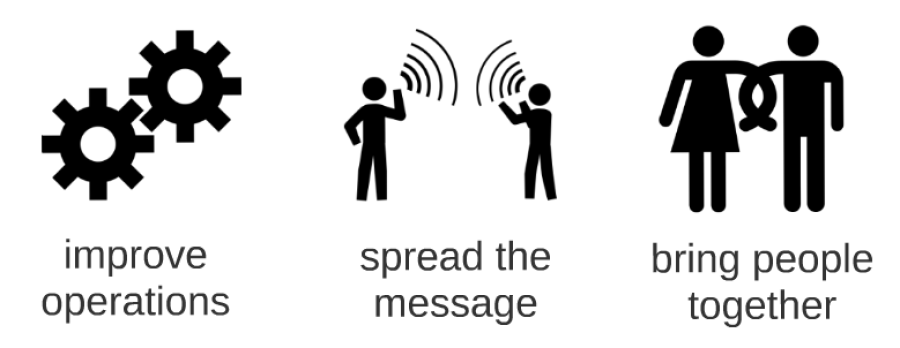
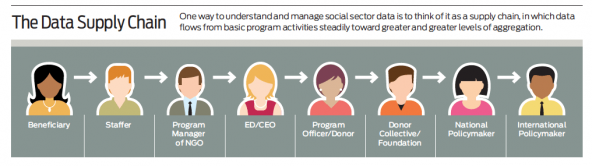
Data presents non-profits with an opportunity to engage the people they serve in an empowering and capacity-buiding way, reinforcing their efforts towards improving conditions on whatever issue they work on. Jim’s “data supply chain” presents the data as a product of the organization’s work, to be passed up the funding ladder for consumption at each level. This extractive model needs to be rethought (as Catherine D’Ignazio and I have argued). The data collected by non-profits can be used to bring the audiences they serve together to collaboratively improve their programs and outcomes. Think, for example, about the potential impacts for the Riders for Health organization he discusses if they brought drivers together to analyze the data about their routes and distances. I wonder about the potential impacts of empowering the drivers to analyze the data themselves and take ownership of the conclusions.
Skeptical that you could bring people with low data literacy together to analyze data and find a story in it? That is precisely a problem I’ve been working on with my Data Mural work. We have a process, scaffolded by many hands-on activities, that leads a collaborative groups through analyzing some data to find a story they want to tell, designing a visual to tell that data-driven story, and paint it as a mural. We’ve worked with people around the world to do this. Picking it apart leaves us with a growing toolkit of activities being used by people around the world.
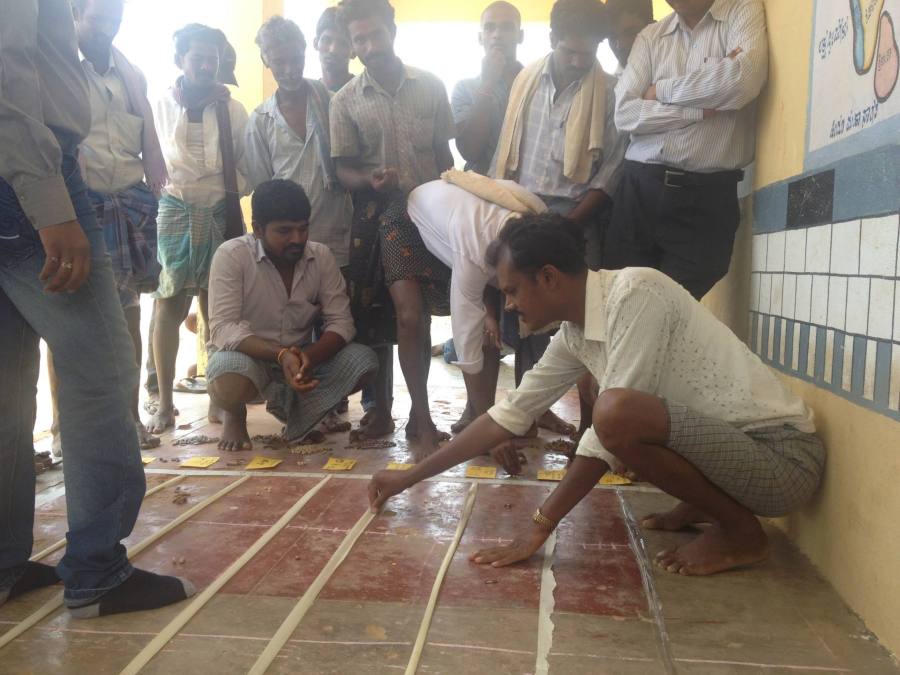
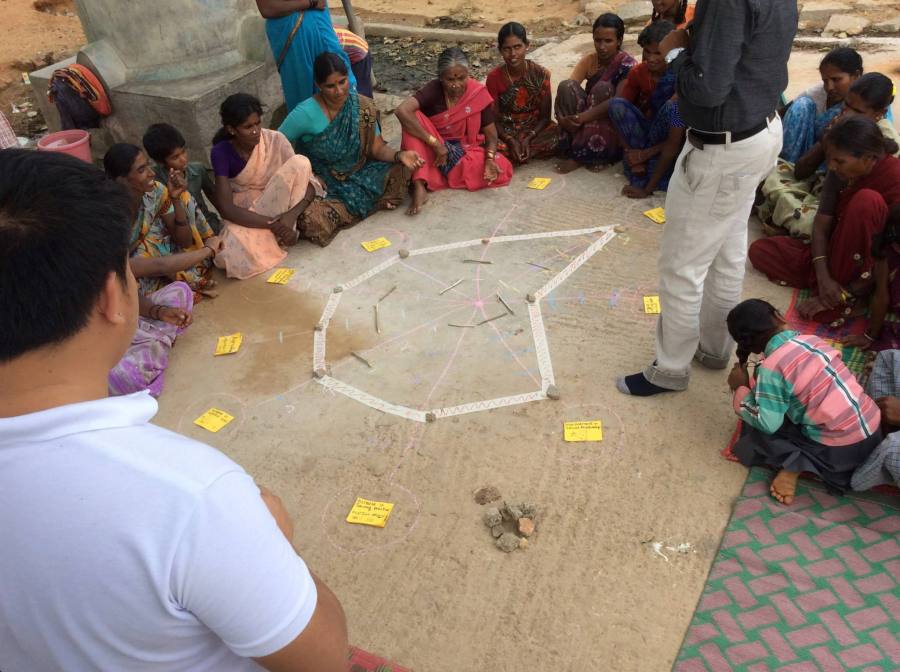
Still skeptical that you can bring people together around data in rural, uneducated settings? My colleague Anushka Shah recently shared with me the amazing work of Praxis India. They’ve brought people together in various settings to analyze data in sophisticated ways that make sense because they rely on physical mappings to represent the data.
These examples illustrate that the social good non-profits can deliver with data is not constrained to operational efficiencies. We need to highlight these types of examples to move away from a story about data and monitoring, to one about data and empowerment. In particular, thought leaders like SSIR and Jim Fruchterman should push for a broader set of examples of how data can be used in line with the social good mission of non-profits around the world.
Cross-posted to the civic.mit.edu blog.

You must be logged in to post a comment.