“Physicalize” Your Data

There are lots of people excited about fancy-pants computer-generated data pictures right now, but I want to remind you that doing things in the physical world can often be more compelling.  Externalizing our ideas into real objects gives us something we can interact with and talk around with other people. Here’s a concrete example.

This photo shows a soda bottle filled up with just the amount of sugar in that drink.  This is a bit of a classic public health example; most people are surprised at the amount of sugar in a soda.  Representing this physically brings home the idea that when you drink the bottle, you’re consuming that amount of sugar.  A bar chart would be far less compelling, and you wouldn’t be able to relate to it.  This is a simple example, but the underlying concept is clear.

What You Should Do:

Consider whether your data can be brought off the page (or screen).  We live in an interactive, three-dimensional, world so you should be creative about bringing your data presentation into it. Surprising your audience with a novel display can engage them long enough for you to tell the rest of your story.

Background Information:

Here’s my standard breakdown of this data presentation:

  • Who – group advocating for healthy eating decisions
  • Goal – inform the audience about the amount of sugar they consume when drinking a bottle (and possible change their behavior)
  • Audience – general public
  • Data – photos of things they would like to change, quotes from patients about their experiences
  • Technique – “physicalize” the data
  • Tools – soda bottle and sugar

Tip of the Iceberg

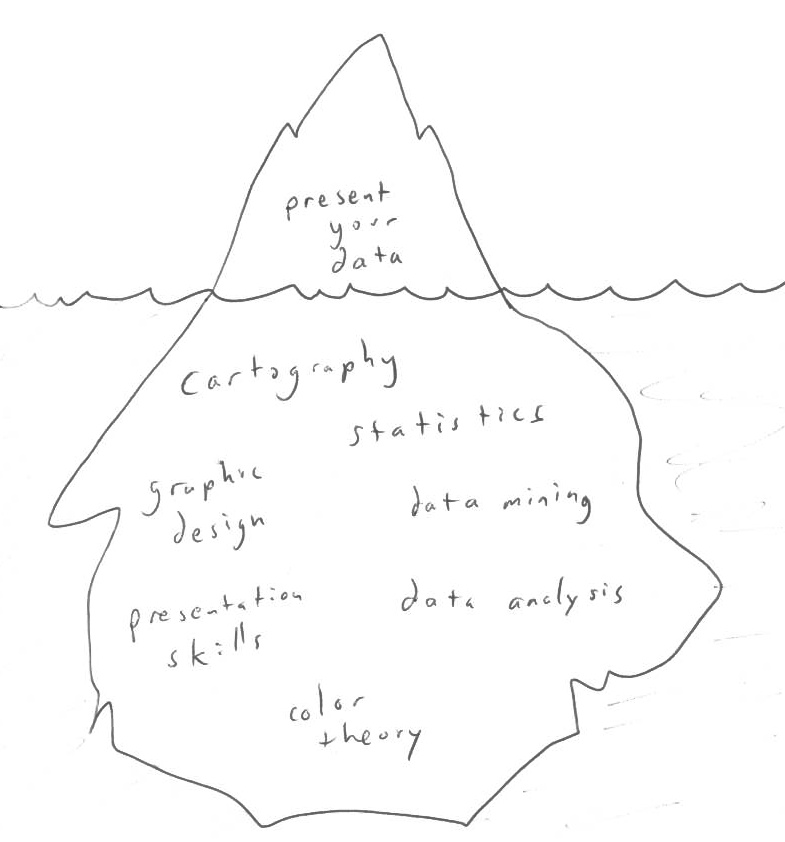
I think many approaches to psychotherapy are about revealing what lies under the surface, so lets carry on in that tradition… when you think about presenting your data, don’t ignore all the fields of study you are building on – the presentation is just the tip of the iceberg.

Cartography, graphic design, statistics, color theory – you will leverage pieces from all these domains to build your creative data presentations.  Each of these is a discipline on its own, so don’t expect yourself to be in an expert in them all.  Just remember to appreciate all the topics that lie under the surface. Acknowledging them can be helpful when you’re frustrated, because it will remind you that there is a reason this stuff is hard!

Word Clouds for Fun and Qualitative Data Analysis

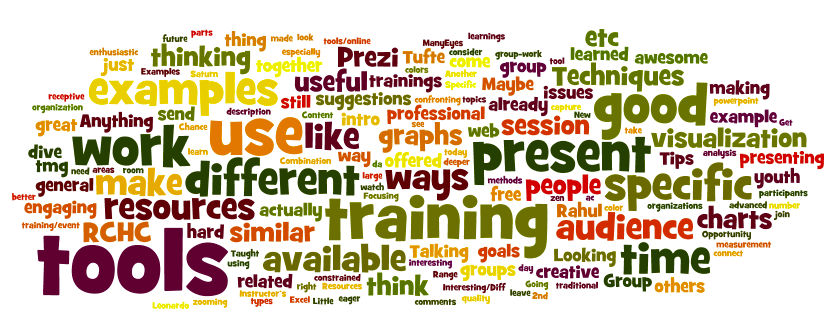
A number of services have sprung up on the web to generate “word clouds” – pictures showing each word in a body of text, where the size of word is based on how frequently the word is used (you can read more about their history on wikipedia). Word clouds are a great way to visualize qualitative data you have – interviews, quotes, etc. Typically you go through some kind of “coding” process to figure out what the common topics are between responses.  World clouds offer another path – automatically showing you the most commonly used words by making them bigger.  Here’s an example word cloud – made out of feedback from my last set of workshops:

Two of my favorite websites that offer this are Wordle and Tagxedo.  Wordle is simpler, but less powerful (I used it to make the picture above).  Tagxedo is more complex, but offers the awesome option to have your cloud be in the shape of an image you upload.

Why You Should Use Word Clouds

Word clouds are a fun way to explore and share your text-based data. I suggest using them as an introduction to a topic area, allowing you to give a general overview with a compelling visual before diving into specifics.  Make a poster of a word cloud in the shape of your logo, built out of your mission statement.  Present a word cloud picture of all your free-text survey responses to find out the common topics, present the image as an overview and then share one or two evocative quotes.

Are You Complexity-Phobic?

Many people I work with tell me they’re worried about using something other than a bar chart to visually represent their data, primarily because they think their audience isn’t ready for it.  They are, very reasonably, expressing their concerns about about visual literacy (which I’ll discuss more at another time).  I hope to break down this worry by presenting techniques to work around it. In this post I’ll start by pointing to a website from a company that does another kind of therapy – the online dating site OkCupid.

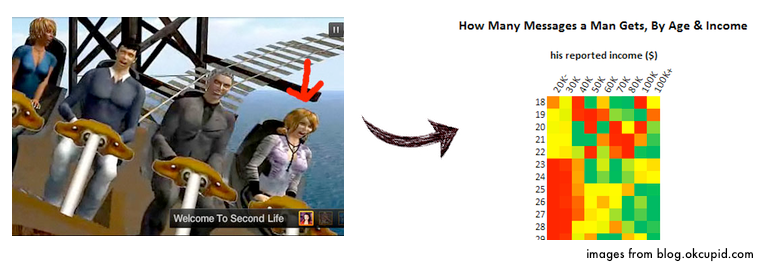
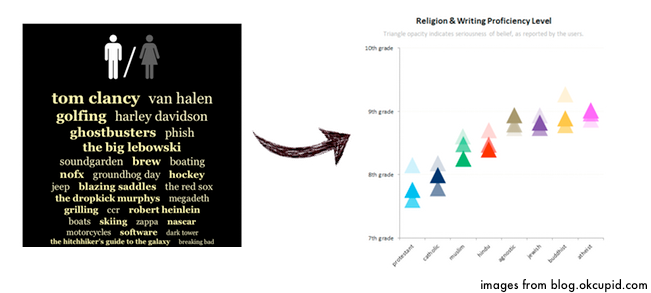
OkCupid, seeing their data as an asset, used to publish an insightful and entertaining blog called OkTrends. They were trying to come up with dating / relationship advice for people based on their warehouse of dating data. My goal in sharing this example isn’t to help you take more attractive pictures of yourself – but rather to talk about the way they share their complex data. These are very nerdy statistics people, but they present their data in entertaining and informative way.  After reading their blog for a while it became clear to me that they serve as a great example of some of the presentation strategies I like best.  Here are two examples that showcase how they start with something simple and build to something complex.

In a post about lies people tell online they start off with a cartoon-based joke about pretending to be someone you’re not.  Through their explanation they move to a complex, uncommon visualization showing how often men get contacted base on their age and income.

In another post, about what white people actually like, they start with a tag cloud of what people have said they are interested in.  Over the course of a single post they move to a complicated, multi-dimensional graph that correlates religious beliefs to writing proficiency.  Crazy.

What You Should Do:

Don’t worry about having an overly-complex data story.  Start with something simple and fun to get your audience interested, then they’ll be ready for your more complex data presentation once you get to it.

Evocative Photos

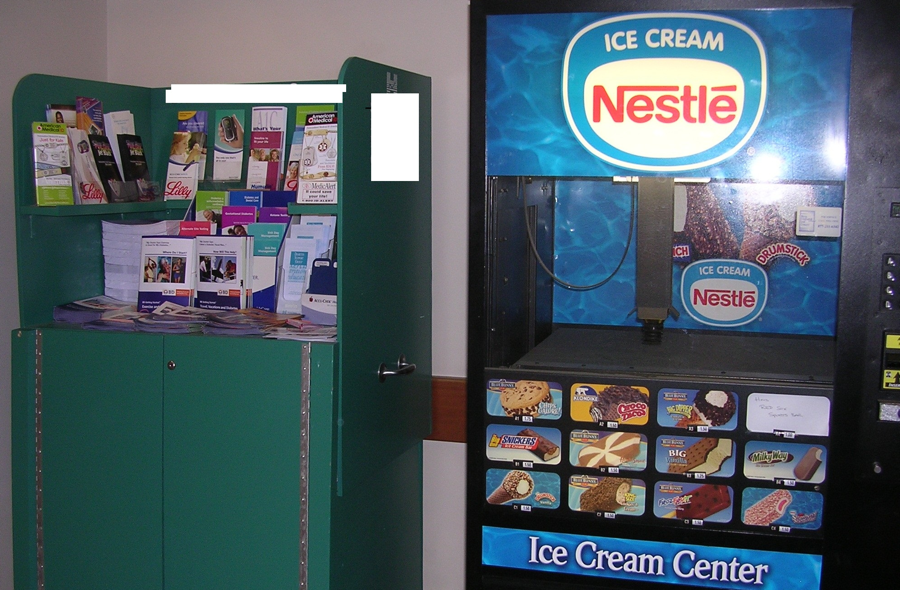
If you have qualitative data, you can use it to effectively personalize your data story. Here is a concrete example from a group advocating for changing the built environment to support people making healthy decisions (you can learn more about this topic from the Prevention Institute).

This photo shows a cabinet with brochures about making healthy eating decisions placed right next to an ice cream vending machine.  This striking visual irony is good at getting people’s attention!  Opening with this kind of evocative image can catch people, giving you a few minutes of their attention to convince them that you’re worth listening to. This image consistently sparks engaged discussion from various audiences – including off-topic ones here at MIT about how awesome it is that the ice cream machine has a robot suction arm!

What You Should Do:

Look around.  Take pictures.  Think about how you can use an evocative photo to engage your audience around the point you are trying to make.

Background Information:

Here’s my standard assessment of the process that produced this data presentation (learn more about this process):

  • Who – group advocating for an environmental approach to health
  • Goal – convince the audience to change policies based on an environmental approach to healthy-decision making
  • Audience – planning committee and policy makers within a hospital
  • Data – photos of things they would like to change, quotes from patients about their experiences
  • Technique – show a compelling photo and share a story
  • Tool – Microsoft PowerPoint

Picking a Data Presentation Technique

As a licensed data therapist, I often advise patients to have a clear process to achieve their desired outcomes.  Having a process helps you measure your progress, and gets you started. I haven’t found many tutorials about what to do when you sit down at your desk to tell a story with your data. What do you do when the rubber hits the road?  Here’s my suggestion.

Find Your Data

Most community groups I work with already have their data in front of them… they’re just trying to figure out how to tell their story with it.  However, it is often the case that when I ask a few more questions, it turns out there is more data lying around.  I hear things like “oh yeah, Sally took some pictures there”, or “yes, we have the same info for last year”.  Make sure you think hard about what data you’ve got.  Don’t overlook something right under your nose.

Characterize Your Data

You should really understand the data you’ve got.  Make a list of words that describe it – chronological, geo-located, sequential, survey, quotes, tabular, interview, etc.  It is helpful to label it as qualitative or quantitative.  To over-simplify, qualitative data is things like quotes or pictures, and quantitative data is numbers.  Most of us have been taught to think that numbers where it’s at, but never forget the power of compelling pictures and quotes.

Identify Goals and Audiences

Force yourself to write down goals and audiences early on. Do it. Tape it to your monitor. Your goals and audiences should guide all your data presentation decisions.  Goals could include getting funding, changing policy, changing social norms, growing organization membership, internal reflection, program assessment.  Audiences could include funders, volunteers, the general public, policy makers, donors, yourself.  Remember that sometimes you have more than one audience in the room – think about their differing expectations and backgrounds.

Pick a Technique

There are lots of creative ways to present data.  I’ve recently been categorizing them into seven groups.  This isn’t meant to be an authoritative list, but rather to help talk about the vast array of options available.

  • personalize your data with stories
  • bring your data in the real world
  • map your data
  • chart your data traditionally
  • chart your data creatively
  • make your data interactive

Each of these techniques fits certain goals and audiences better than others.  I’ll delve into each of these in separate posts.

Make It

Once you know all of the above, use some tools you know, or learn some new ones, and make something!  Simple, right?  My goal is to have this blog help you build things, but I think it is important to have a process to scaffold the creative process.  Now you have something to do when you sit down at your desk!

Need Some Data Therapy?

This blog will share processes, tools and tutorials to help you present and share your data in simple and creative ways.

There is much talk right now about how we live in a time of data and visualization.  There are lots of pretty pictures generated everyday by amazing coders, statistics gurus, and so on.  Then there are normal people. Normal people aren’t statisticians, software developers, or graphic design experts. Normal people don’t have a budget to pay consultants. Normal people in regular jobs have data that they know can help them, and they want to use it.  Normal people need Data Therapy.

This blog is the next step in the MIT Center for Civic Media’s Data Therapy project.  We’ve been trying to address this need for assistance on data presentation because people are asking us for help.  I’ve worked with small community groups on this for the last three years, trying to build their capacity to do their own data visualization and presentation. There are some low-hanging fruit here – we hope to introduce you to them in this blog.

Of course, being from the MIT Media Lab, I think new computers can help. Web-based tools are lowering the barriers of entry for making engaging and creative presentations of data. Rather than encouraging partnerships with epidemiologists, statisticians, or programmers, we see an opportunity to empower community organizations by building their capacity to do this work themselves. You should be the one that knows your data best, and these new tools can help you tell your story with data in exciting and creative ways.

Does this sound relevant to you? If so, welcome to Data Therapy.  Please, have a seat on the couch.  Tell me about your relationship with data 🙂